Published October 26, 2026
How Long Does It Take for Portland, Oregon Home Values to Double?

Almost every buyer in the Portland Metro Area has doubled their money. Here's what 49 years of federal housing data actually shows and what it means if you're moving here.
You’re Thinking About Moving to Portland. So Is Everyone Else. Again.
If you’ve been researching a move to our area here in the greater Portland Oregon Metro Region, you’ve probably already noticed something: you’re not alone. For awhile in the 2010s, you couldn’t escape how “cool” Portland was. We were everywhere. Then in the last 5 years, you couldn’t escape how “bad” Portland was. We were everywhere and not in a “no PR is bad PR” kind of way.
BUT! We’re back!
Oregon ranked first in the entire country for inbound moves in 2025, according to United Van Lines’ 49th Annual National Movers Study (the largest household moving dataset in the U.S.) Nearly two-thirds of all Oregon moves were people arriving, not leaving. The top reasons? Work opportunities and family. And nearly half of those inbound movers reported household incomes over $150,000 a year.
People are arriving from California, Washington, Colorado, Texas, and Montana (but we’re happy to have you no matter where you’re coming from). Many of them are making the same calculations you are: Portland gives you a real city, good jobs, great food, killer access to the outdoors, and at a price that still makes Seattle and San Francisco feel embarrassing by comparison.
But beyond the lifestyle math, there’s a longer-term question worth asking before you sign anything: what does buying a home here actually do for your wealth over time?
That’s where I think the numbers get interesting.
How Often Do Portland Home Values Double?
The short answer: almost every time.
A word about data before I dig into it though. Below is a table showing the doubling cycles over the last 49 years. There’s no uniform table of pricing data available specifically for Portland’s MSA so using math (details at the bottom) we parsed it all out and make estimates based on the most reliable data.
Here’s what we found:
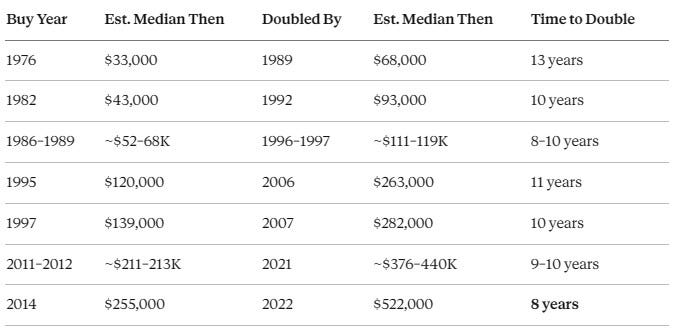
Over the 50-year period, Portland home values compounded at roughly 5.8% per year. At that rate, the Rule of 72 says values double about every 12 to 13 years.
The post-2012 run was particularly striking: homes bought in 2014 essentially doubled in value by 2022 just eight years. That’s the fastest doubling cycle on record in this dataset. While at the other end of the spectrum, if you bought in 1981, just before a large drop, you had to wait 15 years for your home to double (more on that below).
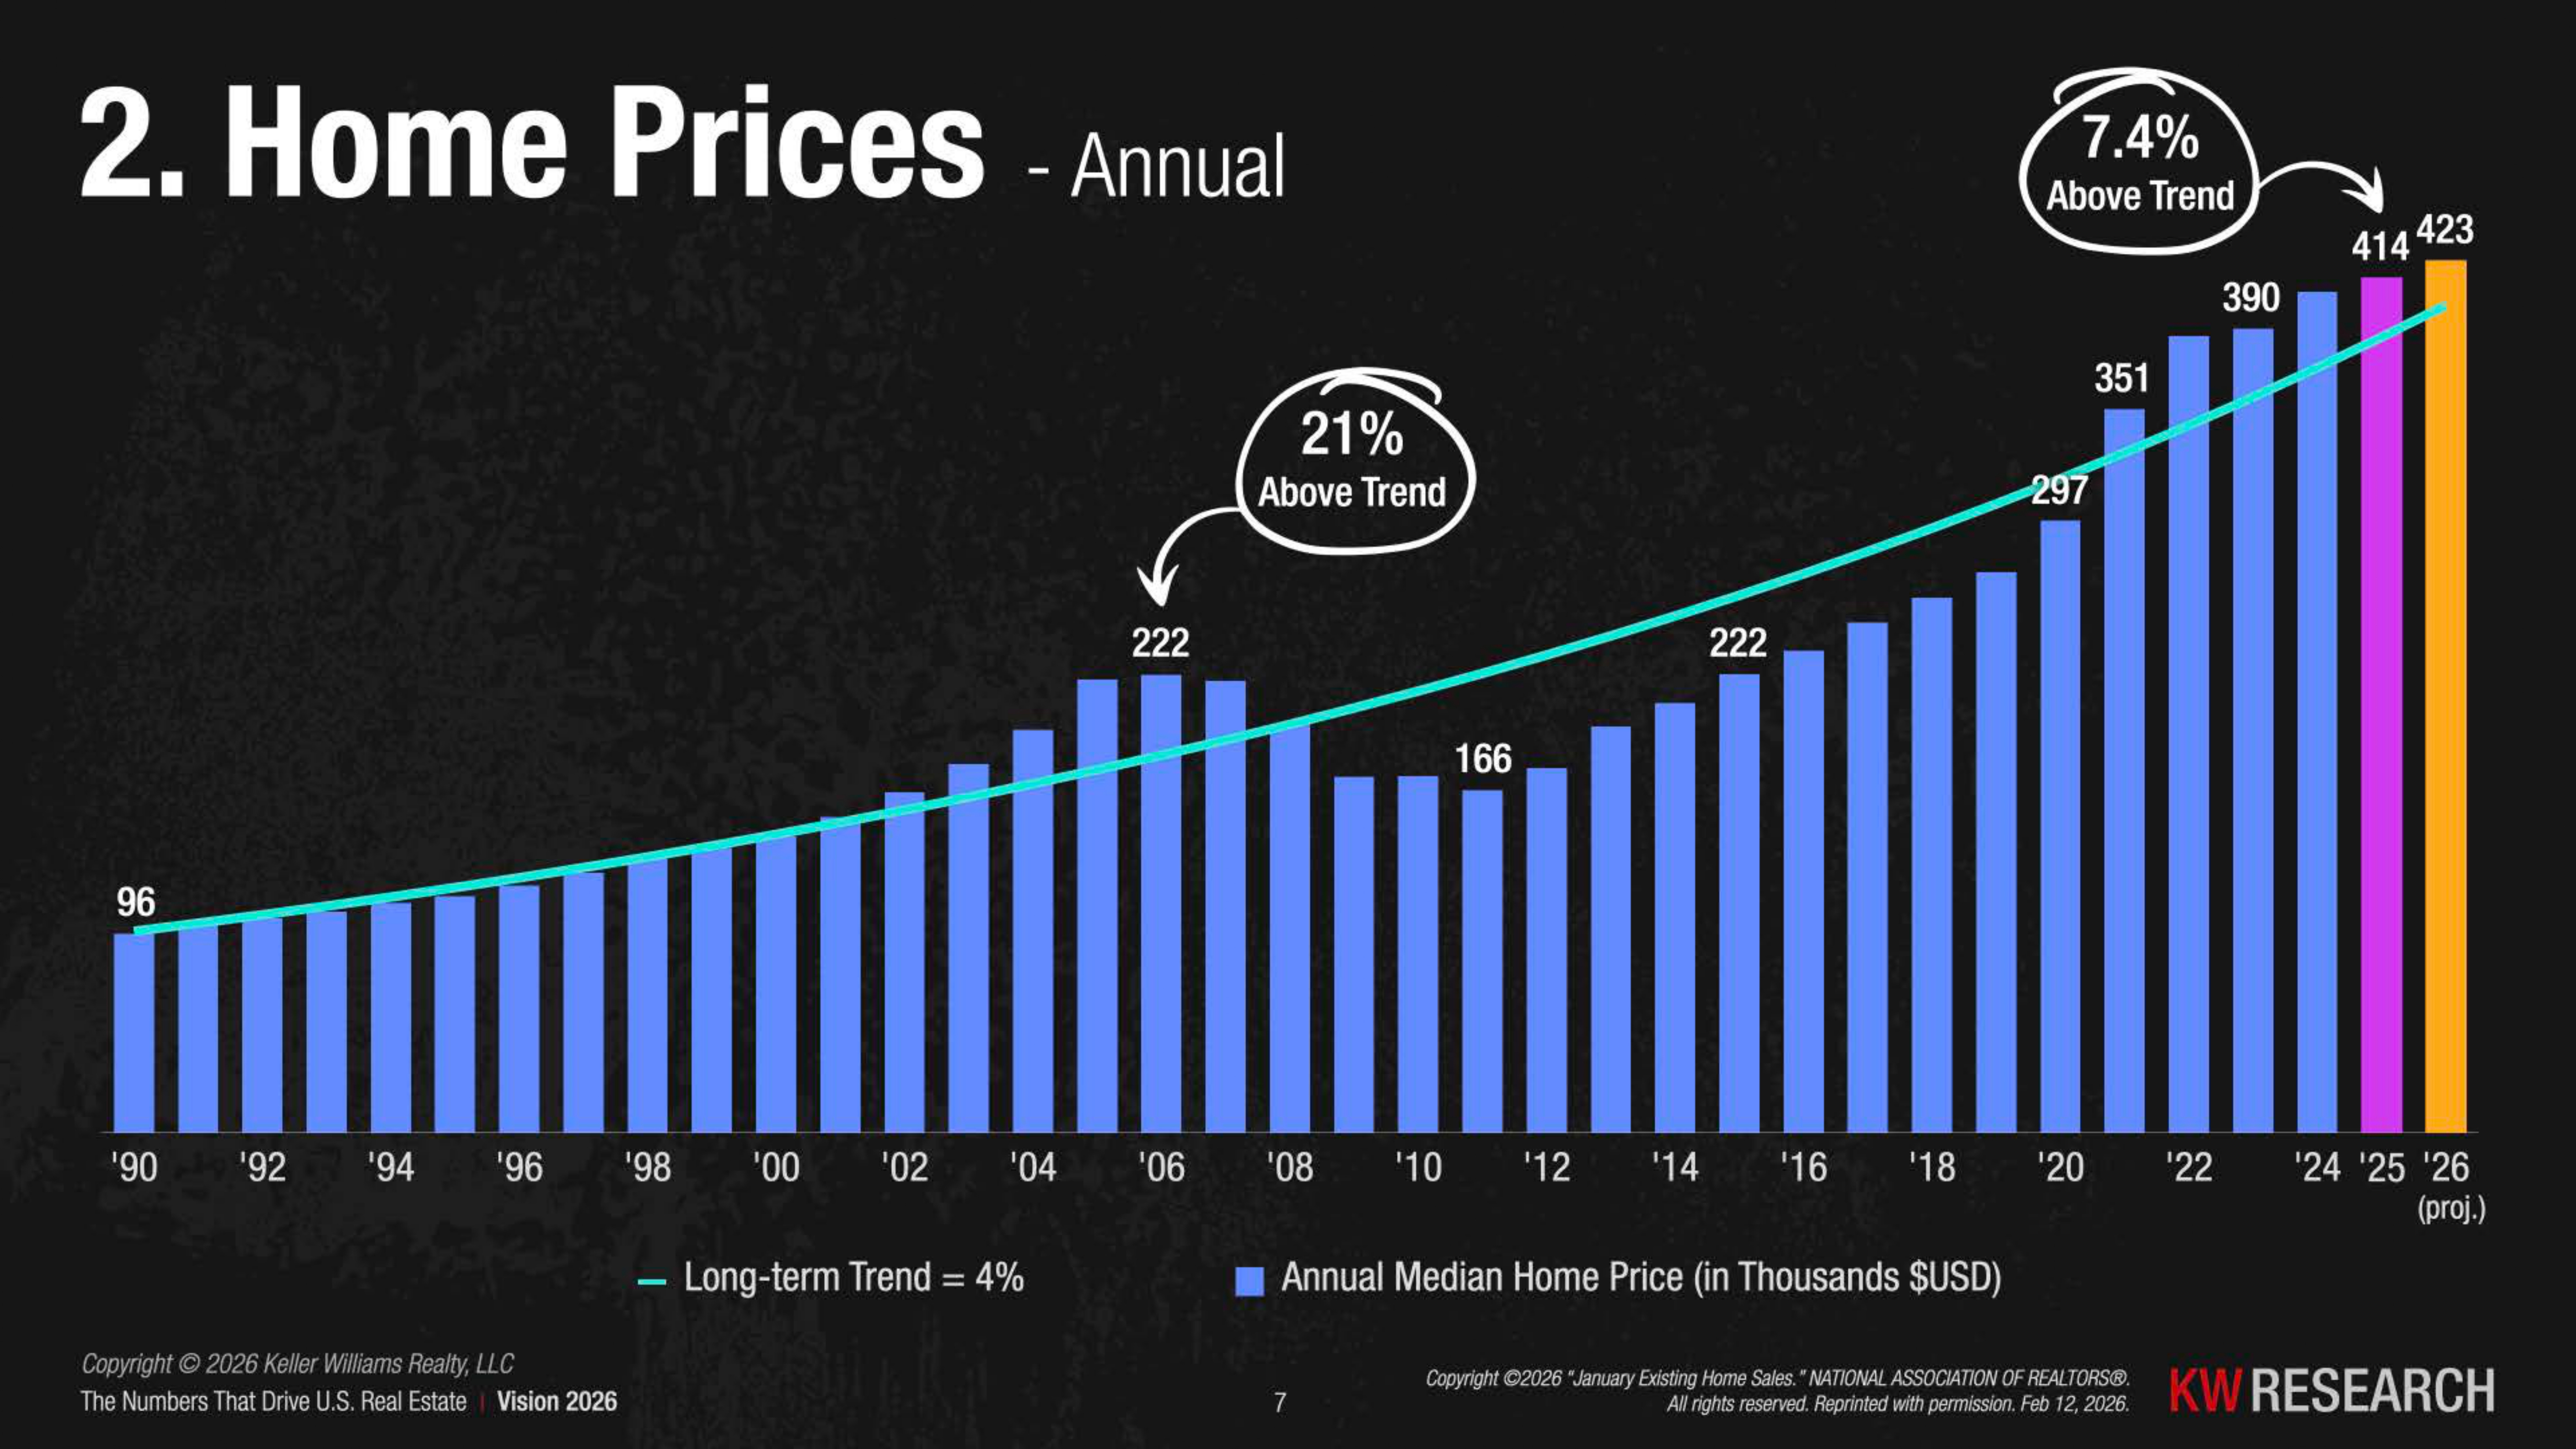
The nationwide average appreciation over the last 49 years is 4% and at that rate, home prices double every 18 years using that same Rule of 72.
Portland Has Cycles. But the Long Trend Is Up.
The path to those price increases is not smooth, and pretending otherwise wouldn’t do you any favors. Portland has had three meaningful downturns in the last 49 years. If you’re moving here and buying a home, you should know what they actually looked like.
Early 1980s Recession
Mortgage rates climbed above 15% nationally, at their peak, closer to 18%. That choked off demand very quickly. Portland prices stalled and temporarily declined as sellers who had to move couldn’t find buyers who could afford the payments. It was a rate-driven freeze, not a structural collapse in demand. When rates came back down, so did buyers.
2008 Housing Crash
This one was structural. Portland prices fell roughly 20 to 25 percent from their 2007 peak to trough before finding a floor around 2011 to 2012 although seasoned real estate pros who lived through it will tell you that the best houses stayed mostly flat at worst. There were ~62,000 sales in the area in 2006 with a median sales price of $250,000 and in 2012, just before the recovery really took off, there were ~44,000 sales in the region with a median price of $200,000. Of course, that’s a real loss on paper for anyone who bought near the top and recovery took several years. Buyers who purchased at the 2007 peak didn’t see full value recovery until the mid-2010s. What they didn’t lose, though, was the home. The ones who stayed eventually came out fine with their prices doubling in about 19 years.
2022–2023 Rate Shock
The Federal Reserve raised rates faster in 2022 than at almost any point in modern history. Mortgage rates went from around 3% to above 7% in less than a year. Portland values, which had rocketed during the pandemic era, cooled quickly. Appreciation flattened. As of mid-2025, prices have recovered to essentially match that 2022 peak but the ride was bumpy.
In every cycle so far, Portland prices have eventually recovered and pushed to new highs. The question has never been if…it was when.
What Drives Long-Term Price Growth in Portland?
The 5.8% annual appreciation rate over 49 years doesn’t happen by accident. There are structural reasons Portland values have trended upward, and they matter for anyone thinking about buying here for the long haul.
1. Population Growth
The Portland metro population has more than doubled since the 1970s, according to U.S. Census Bureau metro population estimates. More people competing for a limited pool of housing is the most basic driver of price appreciation there is. As Oregon continues to attract inbound migration, particularly younger, higher-income households, that pressure on housing supply persists. The state is actively working to attract business and arts back to the area to ensure that the 2025 incoming migration trend isn’t a fluke.
2. Limited Buildable Land
Oregon’s Urban Growth Boundary (UGB), administered by the Oregon Department of Land Conservation and Development, puts a hard line around how far the metro can sprawl. That policy protects farmland and forest outside the boundary, but it also means Portland cannot simply build outward to relieve housing pressure the way Phoenix or Dallas can. Supply is structurally constrained in a way that supports prices over time.
3. Rising Construction Costs
Labor, materials, and regulatory costs have all trended upward over decades. When it costs more to build a new home, the value of existing homes tends to rise with it. New construction sets a price floor for comparable existing homes: if you can’t build it for less, buyers have to pay more for what’s already standing.
4. Wage and Income Growth
Home prices generally track long-term income growth in a metro area. Portland’s economy, anchored by Intel, Nike, Adidas, Columbia Sportswear, and a growing technology sector/data center hubs, has supported rising household incomes over time. As what people earn goes up, so does what they can afford to borrow and spend on housing.
How Does Portland Compare to the rest of the West Coast?
This is the question everyone relocating from California or Seattle is really asking.
In 2024, California’s median home price was around $869,500 and analysts projected it to average $909,400 in 2025.
Portland’s current median sits at somewhere around $529,000. That’s a gap of roughly $380,000 on comparable housing stock. And Portland has the Pacific Northwest lifestyle people move here: mountains, coast, rivers, food culture, and a friendliness that’s hard to beat.
Seattle is a more direct comparison. Portland housing costs run about 40% less than Seattle. That matters enormously when you’re deciding whether buying makes more sense than renting, or whether you can afford to buy in a neighborhood you actually want to live in.
What a Relocating Buyer Should Know
Here’s the practical read on the Portland market, straight from the data:
The market has stabilized after the 2022 peak. Portland values spiked to roughly $522,000 in Q2 2022, the fastest run-up in the 49-year dataset. Since then, prices have cooled and mostly traded sideways. The Q2 2025 estimated median is $529,000, barely above that 2022 high. For a buyer, that means you’re not chasing a rocket ship. You’re stepping into a market that’s had three years to breathe.
Real estate is a long-term asset and this market rewards patience. Short-term price swings happen. We’ve documented three of them in this post alone. But historically, Portland homeowners who hold property 10 to 15 years or longer have benefited from appreciation in every period on record. The 49-year appreciation rate is 5.8%. Apply the Rule of 72: money growing at that rate doubles every 12.4 years. If history holds, a home bought today at $529,000 should be worth over $1 million by 2037 or 2038.
Timing the market is extremely difficult and trying to do so is usually a mistake. Many buyers wait for the “perfect time.” But historically, the biggest gains came from time in the market, not timing the market. As a mentor of mine puts it, the best time to buy real estate is always as soon as you’re able. Another way to put that is this way: real estate is a long game, and the players who win are the ones who get in and stay in. Every year you’re renting in Portland is a year your landlord’s equity grows, not yours.
Interest rates matter less than people think over time. Rates move up and down, sometimes dramatically, as 2022 showed. That can be hard to watch when you’re waiting for “the perfect time” to buy or refinance. But what you’ll find when you zoom out is that over multi-decade periods, Portland price growth has been driven far more by structural factors: limited land supply from the Urban Growth Boundary, sustained population growth, and rising construction costs. Those don’t go away when rates shift. The buyers who got in during the 1980s despite 15% mortgage rates and held on came out ahead.
The downturn years weren’t disasters for patient buyers. Even the people who bought at the worst possible time, the 2006 or 2007 peak, eventually saw their values recover and then double. It took until around 2025 for that group to hit 2x, a 19-year ride, but they got there because they held on. The only way to lose on Portland residential real estate historically has been to sell at the bottom.
Oregon has no sales tax. This matters more than people expect when relocating from California or Washington. Property tax rates in Oregon don’t reset on purchase so you avoid that trap and with no sales tax, you can really pack away the savings.
Where Does the Market Go From Here?
Anyone who tells you they know exactly what Portland home prices will do in the next 24 months is selling something.
What the data does tell us:
The market in 2026 is more balanced than it has been in years (although that is now shifting as we get into the later half of the year and interest rates continue to rise). Homes are sitting longer, averaging around 73 days on market, which means buyers often have time to breathe, negotiate, get inspections done, and make decisions without the complete panic-offer environment of 2021.
If mortgage rates ease, and most economists expect some movement in that direction over the next 12 to 18 months, buyer activity will pick up and competition will return. The window of relative calm may not stay open indefinitely.
The Portland metro has not had a decade in the last 49 years where prices failed to recover.
FREQUENTLY ASKED QUESTIONS ABOUT PORTLAND HOME VALUES
How often do Portland home values double?
Historically, about every 12 to 13 years. Using the FHFA House Price Index for the Portland-Vancouver-Hillsboro metro area, home values have grown roughly 5.8% per year since 1976. The fastest doubling took just eight years, for homes bought in 2014. The slowest took about 19 years, for buyers who purchased at the 2007 peak.
Have Portland home prices ever gone down?
Yes, three times in the last 49 years. Prices stalled in the early 1980s when mortgage rates climbed above 15%, fell roughly 20 to 25% after the 2008 housing crash, and flattened during the 2022 to 2023 rate spike. In every case, values eventually recovered and reached new highs.
Is 2026 a good time to buy a home in Portland?
The market is more balanced than it has been in years. Homes are averaging around 73 days on market, which gives buyers more time to negotiate and get inspections done. The estimated median of about $529,000 sits just above the 2022 peak, so prices have had three years to settle rather than racing upward.
How do Portland home prices compare to Seattle and California?
Portland is considerably more affordable. California’s median home price was about $869,500 in 2024, compared to Portland’s current median of around $529,000. Housing costs in Portland also run about 40% less than in Seattle.
Why do Portland home values keep rising over time?
Four main reasons: steady population growth, limited buildable land because of Oregon’s Urban Growth Boundary, rising construction costs, and long-term wage growth anchored by employers like Intel, Nike, Adidas, and Columbia Sportswear.
Does Oregon have a sales tax?
No, Oregon has no sales tax. That surprises many buyers relocating from California or Washington, and it can add up to real savings over time.
Thinking About Making the Move?
Relocating to a new city and buying a home at the same time is a lot to manage. You’re figuring out neighborhoods, school districts, commute times, and price points, all from a distance, often on a deadline.
That’s exactly where we come in. At Kama Homes Realty Group, we work with relocating buyers every day. We know the neighborhoods, we know the data, and we know how to help you make a confident decision without flying back and forth six times before you write an offer.
If you’re planning a move to the Portland metro and want to talk through what the market looks like right now and how that fits your specific situation, reach out directly.
503.858.0587
Hello@KamaHomes.Com
Portland, Oregon
Methodology & Sources
A word about data. There’s no uniform table of data available that I can find that other sources agreed on about median home prices going back all the way to 1976. So yes, I used some ai to help me parse it all out and make estimates based on the most reliable data.
Using the FHFA All-Transactions House Price Index for the Portland-Vancouver-Hillsboro MSA (Series: ATNHPIUS38900Q), the same federal index appraisers and lenders rely on, I tracked every price doubling cycle going back to 1976. The index measures how much the same homes appreciate over time using millions of repeat sales. It’s about as clean a measure of real-world price change as you’ll find and I had it work backwards from known data points to estimate pricing, then double checked those to make sure we’re in “the zone” across multiple sources. Index details below…
Index: FHFA All-Transactions House Price Index, Portland-Vancouver-Hillsboro OR-WA MSA Series ID: ATNHPIUS38900Q Retrieved from: FRED, Federal Reserve Bank of St. Louis ( fred.stlouisfed.org/series/ATNHPIUS38900Q ) Original source: U.S. Federal Housing Finance Agency ( fhfa.gov/data/hpi ) Index base: 1995 Q1 = 100. Not seasonally adjusted. Q2 (April) values used throughout.
Formula: Estimated Median = (Historical Q2 HPI ÷ 452.33) × $529,000
All estimated medians are relative price-level estimates, not recorded transaction prices.
Additional sources:
- Migration data: United Van Lines 49th Annual National Movers Study (2025)
- Oregon population growth: Portland State University Population Research Center (December 2025)
- Metro population history: U.S. Census Bureau metro population estimates
- Urban Growth Boundary: Oregon Department of Land Conservation and Development — oregon.gov/lcd
- California median home price: California Association of Realtors, via realestateagentpdx.com
- Seattle price comparison: moverjunction.com
- Days on market / 2026 market conditions: Hatch Homes Group Portland Market Report (March 2026)
This post is for informational purposes only and does not constitute financial, legal, tax, or investment advice. Past performance of real estate markets does not guarantee future results.